High Triglycerides: What the Number Means and How to Bring It Down
Triglycerides are the most diet-responsive marker on a standard lipid panel, and a stronger insulin resistance signal than LDL alone. Here's what drives yours and what actually moves it.
What triglycerides actually are, and why they matter more than most people think
Triglycerides aren't the same as cholesterol. They're energy carriers, and when elevated, they're usually a direct readout of what you've been eating and how well your body handles carbohydrates.
Triglycerides are fats that circulate in the blood, the form in which the body stores and transports energy. When you eat more calories than you need (particularly from carbohydrates and sugar), the liver converts the excess into triglycerides and packages them into VLDL particles for transport to fat tissue. A fasting triglyceride test measures how much of this is circulating in your blood after an overnight fast.
The widespread assumption is that high triglycerides come from eating fat. The evidence points the other direction: dietary fat has a relatively modest effect on fasting triglycerides. The primary drivers are sugar, particularly fructose, which the liver converts to fat via de novo lipogenesis, refined carbohydrates, and alcohol. This is why triglycerides often rise on low-fat diets that replace fat with carbohydrates, and fall sharply on low-carbohydrate diets.
Triglycerides don't just measure diet. Elevated fasting triglycerides alongside low HDL is a classic metabolic syndrome pattern, a strong signal of insulin resistance even when fasting glucose and HbA1c look normal. If your LDL is borderline but your triglycerides are high and HDL is low, the cardiovascular risk picture looks meaningfully worse than LDL alone suggests.
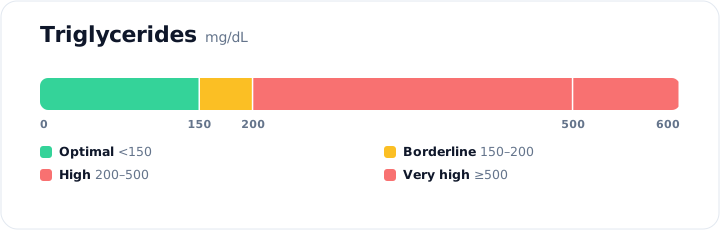
What your triglyceride level actually means
The ACC/AHA thresholds, what each zone means for cardiovascular risk, and what action is warranted.
| Triglyceride level | Classification (ACC/AHA) | Clinical picture | Status |
|---|---|---|---|
| Below 150 mg/dL (1.7 mmol/L) | Normal | Desirable range. Low cardiovascular risk from triglycerides at this level. | Normal |
| 150–199 mg/dL (1.7–2.2 mmol/L) | Borderline high | Mild elevation. Worth addressing with dietary changes. Assess alongside HDL — TG:HDL above 3:1 at this level is still a meaningful insulin resistance signal. | Borderline |
| 200–499 mg/dL (2.3–5.6 mmol/L) | High | Elevated cardiovascular risk. Dietary intervention required. Assess for secondary causes (hypothyroidism, diabetes, medications). Consider medication if lifestyle changes insufficient after 3 months. | Address |
| 500+ mg/dL (5.6+ mmol/L) | Very high | Significant risk of acute pancreatitis. Usually requires both medication (fibrates or prescription omega-3) and urgent dietary overhaul. Discuss with your doctor promptly. | Act urgently |
What causes high triglycerides
Almost always a combination of diet, insulin resistance, and sometimes secondary conditions. Getting the cause right determines whether dietary changes alone are sufficient.
How to lower triglycerides
The evidence is clearer here than for almost any other lipid marker, triglycerides respond fast and specifically to the right dietary changes. Here's what works and what doesn't.
- Added sugar, particularly fructose from juice, soda, honey, and syrup
- Refined carbohydrates, white bread, pasta, pastries, processed snacks
- Alcohol, even moderate intake contributes significantly
- Excess calories overall, regardless of source
- Sedentary lifestyle, impairs triglyceride clearance
- Cutting added sugar and refined carbohydrates sharply
- Reducing or eliminating alcohol
- Omega-3 fatty acids (oily fish, fish oil 2–4g EPA/DHA daily)
- Aerobic exercise, lowers TG independently of weight loss
- Low-carbohydrate diets, consistently the strongest dietary effect
References & Guidelines
- Grundy SM et al. — ACC/AHA Guideline on the Management of Blood Cholesterol. Circulation. 2019;139(25):e1082-e1143
- American Diabetes Association — Standards of Medical Care in Diabetes 2024 (lipid management)
- Miller M et al. — Triglycerides and Cardiovascular Disease: A Scientific Statement from the AHA. Circulation. 2011;123(20):2292-333
- NCEP ATP III — Third Report of the Expert Panel on Detection, Evaluation, and Treatment of High Blood Cholesterol in Adults (2002)
Frequently asked questions
What is a high triglyceride level?
Do high triglycerides cause symptoms?
What is the fastest way to lower triglycerides?
Are high triglycerides the same as high cholesterol?
Does dietary fat cause high triglycerides?
Do I need medication for high triglycerides?
See your full lipid picture, not just one number
Upload your blood report and get triglycerides, LDL, HDL, and TG:HDL ratio scored together, plus the dietary changes most likely to move your specific pattern. 45 seconds, free.
Analyze My Blood Test →